Search for answers or browse our knowledge base.
SalesAnalysis Reports & Pivot Tables
Purpose
This document examines the options in, examples of, and “tips & tricks”for SalesAnalysis reports & pivot tables
Prerequisites
To use the features described below, you must have all of the following:
- AccountReporter License
- Microsoft Excel version 2007 or later
- Working knowledge of basic reporting functions and features
Types of Sales Reports
There are several types of Sales Reports available in Sales Analysis, though your options might differ according to your configuration. Below is a general description of each type.
Bookings Reports
The “Bookings” report shows booking totals, by company, by Booking Month. (This option is only visible in SalesAnalysis Enterprise, if “Bookings” are enabled in the Configuration Profile. See your administrator with questions).
Billings and Commissions Reports
The “Billings/Commissions” report shows sales and firm commission totals, by company, by either invoice month, commission earned month, or commission paid month. The “Billings/Commissions (Part Number)” report is the same, but also includes sales totals by manufacturer and/or customer part numbers.
Billings and Commissions YTD Reports
The “Billings/Commissions YTD” (Year To Date) report will compare data for the months between the beginning of your fiscal year, through your last complete data entry month, for two consecutive years. (The first month of your fiscal year is set in the Configuration Profile. The default is January, but should not be changed without the guidance of ESI Support. The “last complete data entry month” is specificed by your Date Control Profile. See your Help > Maintenance in SA for more information).
Other than the usual selection criteria (customer, principal, etc if desired), you only need to specify the “YTD Year”by choosing from the drop-down menu.
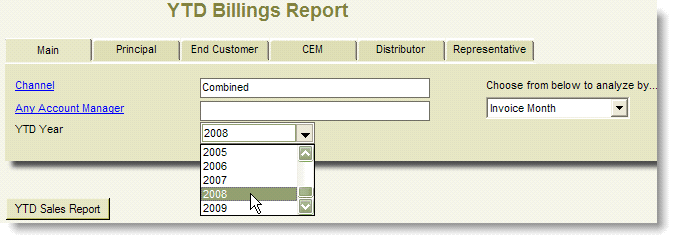
The Billings/Commissions YTD report is a comparison of the sales and commissions for the same months of the “YTD Year”vs. the previous year. (Example: in the above screenshot, the report would compare 2008 vs 2007).
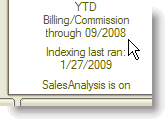
The months included for both years years of data would only be through the month specified in your Date Control Profile (“DCP”). See lower left corner of your SA screen for the current DCP setting. (Example: the below screenshot indicates my DCP is set to Sep. 2008. See your administrator with questions about your current DCP)
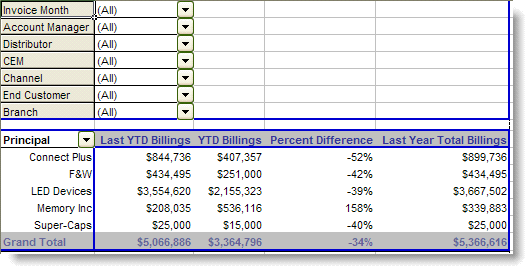
The resulting report would look something like the below, where:
- “Last YTD Billings”represent Jan-Sep 2007
- “YTD Billings”represent Jan-Sep 2008
- “Percent Difference”is the difference between 2007 and 2008’s numbers, and
- “Last Year Total Billings”represents the Jan-Dec 2007 (the full year)
Account Manager Commission Statements
The “Acct Mgr Commission Statement” displays Account Manager Commission information. Managers may choose to run this report for each salesperson in conjunction with payroll, as documentation of how commissions were calculated. (This option is only available if AM Commissions are enabled in your Configuration Profile. See your administrator with questions).
Understanding Selection Criteria
Regardless of which SalesAnalysis report you run, the data gathered will be directly affected by the Selection Criteria you enter:
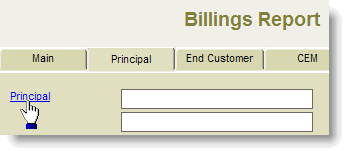
Anything you do not make a choice for, is like saying “give me all.” (Example: If you do not pick a principal, you get results for all principals). Your options in any picklist field are to pick “one”or “none.” (Example: You can pick one principal, or none at all, but you cannot select two principals).
When entering date range criteria, it’s usually best to choose one “type”of date only, such as Invoice date or Commission Paid date. (Example: If you use a Commission Paid date range of 12/01/08 –12/31/08, and an Invoice date range of 10/01/08 –10/31/08, you would exclude any billings that you got paid for in December, but might have actually been stragglers that shipped in September).

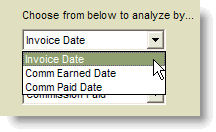
“Analyze by”dropdown menus are change how the results display, so that you can “gather”data by one criteria, but “display”it by another. (Example: You use a “Commission Paid Date”range of 12/01/08 –12/31/08, so your report will contain totals for everything your firm was paid commission for in December. Choosing to “Analyze by”Invoice Date, means your report is still for everything you were paid in December, however you “see”that was based on shipments in September, October, and November).
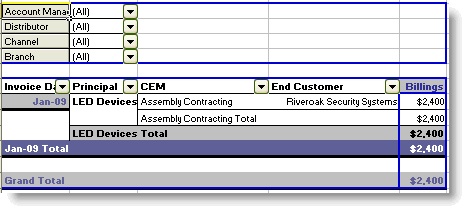
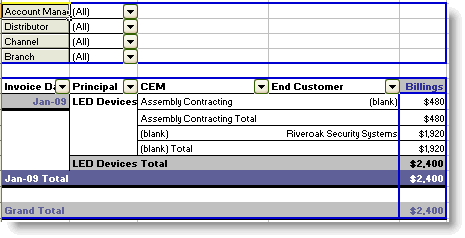
“Share Totals”is new. When a billing has more than one account on it (i.e. CEM and End Customer), the totals will be split based on each account’s “share”of the total, according to the splits you’ve set up in SalesAnalysis. (Example: You run a report, using the selection criteria of one CEM, one End Customer, and one Invoice month. See the same information, displayed both ways to below):
“Grand Totals”button:
“Share Totals”button:
Pivot Table Manipulation
Some of the reports generated by SalesAnalysis include automatically-created pivot tables. The example below is of a “Billings/Commissions (Part Number)”report run for Invoice Dates 01/01/07 –12/31/08 (for example, to compare what was shipped for all of 2007 and 2008). Note that this report, when generated, actually contains multiple worksheets (“tabs”) to display the data different ways. The most popular tab among users is the “Sales Table”because it contains Sales and Firm Commissions information at the same time.

Because this date range spans 24 months, the resulting report defaults to displaying each of those 24 months:
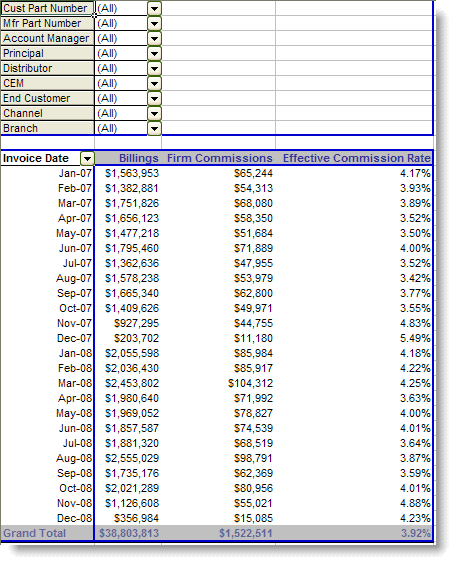
Manipulating the pivot table is simply a matter of “dragging & dropping”the various data categories from the upper left corner, in and out of the table below them. Watch for the “dotted line divider”to know where a particular column would be placed. Make sure it’s a vertical line to indicate the data will become a column once you let go. (To remove a column, drag and drop that column header back up to the list of categories in the upper left corner).

Instructions for Commonly Requested Pivot Table Tricks
Click on the links below for more information on manipulating your pivot tables
https://help.empoweringsystems.com/knowledge-base/sorting-by-descending-dollar-value-and-showing-top-10-within-pivot-tables/ Sort by descending dollar value, through multiple layers and categories, and view “Top 10”(or “Top 25”etc) accounts.
https://help.empoweringsystems.com/knowledge-base/side-by-side-yearly-comparisons-within-pivot-tables/
Condense 24 months into two years (or 12 months into four quarters, for example) for easier comparison, by and compare time periods “side-by-side”.
