Search for answers or browse our knowledge base.
Sorting by Descending Dollar Value and Showing “Top 10” Within Pivot Tables
Purpose
This document provides instructions for manipulating a standard Billings/Commissions report, generated by AccountReporter, to display results by descending dollar value.
Prerequisites
Basic understanding of how to run a Billings/Commissions Report.
Manipulating the Report
After running a standard Billings/Commissions report, follow the steps below. This example uses the “Billings Table” tab of the resulting MS Excel Workbook.

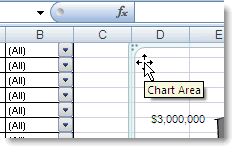
Click here to select the entire chart area, and move it further to the right of the spreadsheet. This will allow more room for your table after making your modifications.
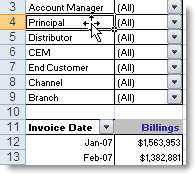
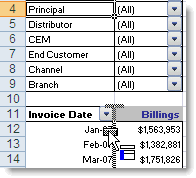
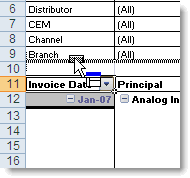
Bring down the desired fields (i.e. Principal and Customer) by clicking on each category in the upper left, and “dragging” then “dropping” it into your table below. (Note the dotted-line vertical divider indicating where that column will be dropped). Then drag the Invoice Date field from the table and drop it in the upper left (this way you have “totals” for that time period instead of by month).
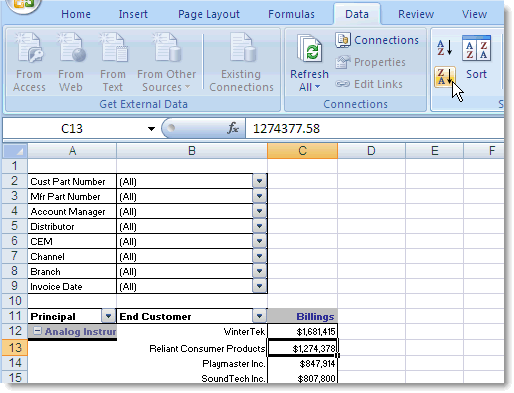
Click on on of the values in the Billings column (it doesn’t matter which one), then use the Data option for “Sort Z to A”. This will sort your Billing totals from largest to smallest, including in each category (i.e. by Principal, etc).
If you’d like to limit the results to just the Top 10 (or 25, etc) accounts, click the “End Customer” drop down menu (or the dropdown header for whichever category you want to limit), and choose “Value Filters > Top 10”
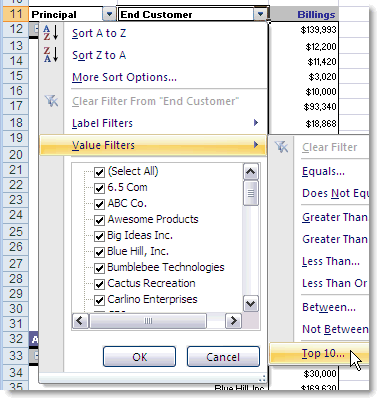
In the next box, set the quantity you want to see, and click OK.

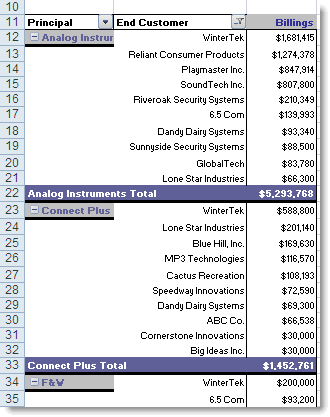
In the example below, we now see the Top 10 End Customers for each Principal. Even as you manipulate the pivot table using different filters from above, the customers will stay in descending dollar value within those other filters.
