Search for answers or browse our knowledge base.
Understanding “Annual > Total Value” Views in SalesAnalysis
Within SalesAnalysis, there are views like the one below that are “Annual > Total Value” views. These are found in several areas under the Bookings and Billings views.

These views are meant to give an “snapshot” of the sales figures for an entire year at a glance. For this reason, the data is displayed in monthly columns left to right with a “Total” column on the far right. In the interest of fitting this many columns left to right without forcing the user to scroll back and forth, the numbers are displayed as “$ in ‘000 (thousands)” by default (see note at bottom of page). This is indicated in the column header to the left of the “Jan” column. Because these are dollars in thousands, the actual figures are rounded up or down to the nearest thousand. Totals of $500 – $1499 would be displayed as a “$1”, while a total of $499 or less would be displayed as “$0”.
For example, in the screenshot above, the cursor is pointing to annual total for 2005. This number is representing a total of approximately $15,419,000.00 in sales for the year. Likewise, the customer ABC Co. had a total of approximately $40,000.00 in sales for December 2005.
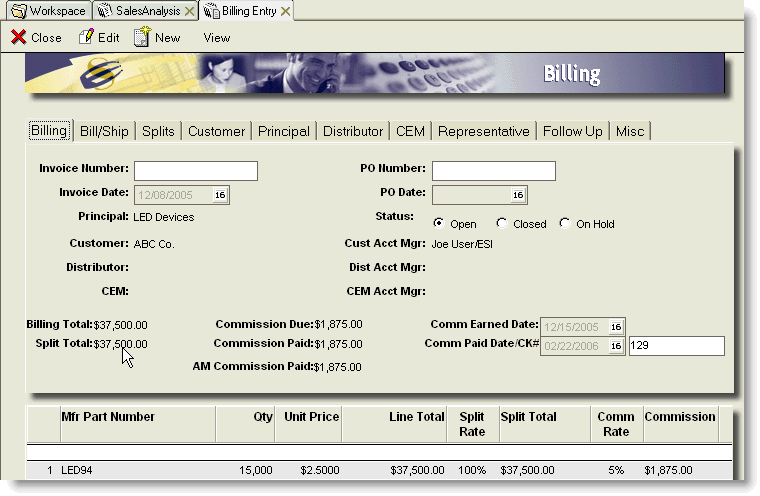
If desired, additional information can be viewed by continuing to expand the various layers and ultimately opening a specific document. In the example below, I have continued to expand under ABC Co. and eventually opened a billing for December 2005 revealing an actual sales total of $37,500.00 that was rounded in the view to display as “$38” (again, rounded up to the nearest thousand).


Note: your administrator can change this preference in the SalesAnalysis Configuration Profile, to display whole dollars instead, but this will result in needing wider columns to accommodate the extra digits, which means you may need to scroll left and right to see the later months of each year.
