Search for answers or browse our knowledge base.
AccountManager Forecasting
Purpose:
To explain the options, uses and “best practices”for AccountManager Forecasting.
Prerequisites:
The below information is based upon the following assumptions and conditions:
- Your administrator has enabled (or will enable) the appropriate Forecast-related options in your AccountManager configuration profile. Administrators, please contact support for assistance.
- Your administrator has set the Forecast Profile (default “start date”for forecast views)
- You will review the AccountManager “Help”documentation on “Forecasts”
Types of Forecasts Available:
- Line Item Forecasts on Opportunities and Design Wins
- Forecast Documents that “stand alone,”and are not related to opportunities or design wins
Line Item Forecasts on Opportunities and Design Wins:
Line Item Forecasting is available on Opportunities and/or Design Wins. Your organization may choose to use one, both, or neither of these forecasts.
- Forecasts are literally part of the line items of Opptys or DWs, so it’s a system-wide setting as to whether they are enabled or not.
- The first monthly “bucket”is governed by the Production Date on that Oppty. If no production date available, then it uses current Forecast Profile date.
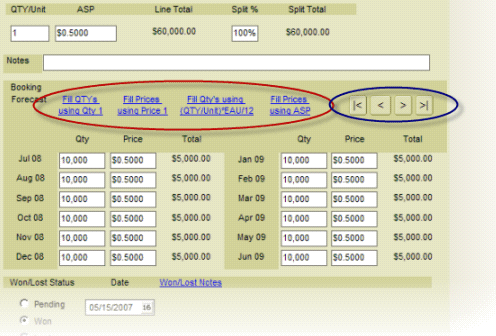
- Use the hyperlinks to fill data such as qty’s and pricing more quickly (red circle below)
- Use arrows to roll the forecast forward or backward one month or year, at a time (blue circle to the right)
Stand-alone Forecasts:
Your organization may choose to use these in addition to, or instead of, Line Item Forecasts.
- Forecasts can be configured to contain just a small amount of information (i.e. Principal, Customer, and Dollar Amount per month), or more detailed information (i.e. Principal, Customer, CEM, Part Number, Product Line, Quantity, Unit Price, etc).
- See “Help”documentation for detailed instructions on entering Forecast documents.
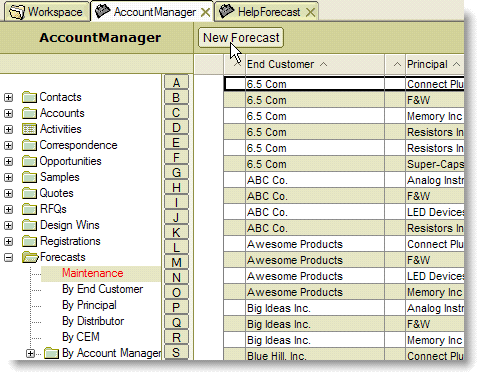
- If using Option 1 in the configuration profile (see your administrator), the “Maintenance”view can be used for data entry, by clicking in the cells.
- Forecasts can also be filled out in more detail by using the “Form”(clicking the “New Forecast”button). If using Option 2 in the configuration, this is the only way to enter a new forecast.
Configuration Options:
- Forecast Period: Monthly or Quarterly (applies to any/all forecast types you enable).
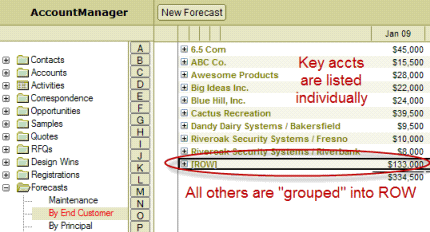
- Key Acct vs. ROW: ROW is an acronym meaning “Rest Of World”in many industries, usually referring to lower-tiered accounts, perhaps generating revenue or opportunities under a certain amount. Essentially, it is the opposite of “Key Accounts”. Enabling this feature means you will specify which accounts are your “Key”accounts (checkbox will appear on account profiles). Accounts not specified as “Key”become part of one large “ROW”number in forecast views and reports. The only place you will see ROW account names listed specifically is in the Maintenance view.
- Entry Method: This option is where you’ll specify whether you want to enter one thing (Option 1), or two things (Option 2) in each forecast period. See below for details.
- Option 1:
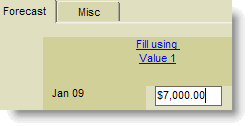
- Users enter one item (forecasted dollar amount) for each forecast period
- Option 1:
-
-
- The “Maintenance” view may be used for quick & easy data entry (similar to working in an Excel spreadsheet).
-

- Option 2:
- Users enter two items (Quantity and Unit Price) for each forecast period. The forecast dollar amount is then computed automatically.

-
- The “Maintenance”view can be used for viewing and analyzing, but not for data entry. Opening the Forecast document to make changes is required. The “Maintenance” view will still only display computed dollar totals and will not display specific quantities and unit prices.
- Number of Account Tabs (columns) to display in views: The default is 2 (i.e. Principal and Customer). More may be included, but will obviously increase the width of the view, and likely mean users have to scroll left-to-right to see all the data.
- Display Part Number Fields: This pertains to the “stand alone”Forecast forms only. Administrators can decide which combination of Mfr PN, Cust PN, and Product Line info is available for forecast entry, however a common choice is to disable part number information on the stand-alone forecasts, in order to keep them very simple, and encourage adoption of this forecast method. Some companies may use Line Item forecasting for PN-specific forecasts, and stand-alone for more general forecasting.
- Number of Data Columns in Views (6 or 12): Choose how many forecast period columns display. If you forecast monthly periods, you may want 12 columns, however if you’re forecasting quarterly periods, perhaps 6 columns will suffice.
- Default Forecast Date (Line Item forecasts only): Choices are “Production Date” (which sets the first forecast period in the line item to match the Production Date on the oppty or design win), or “Forecast Date” (which sets the first period in the line item to match the current Forecast Profile date).
- Synchronization with SalesAnalysis: Contact ESI Support to enable. You may choose to synchronize either (or both) types of forecast with SalesAnalysis, but consider the following carefully:
- If both Line Item Forecasts and stand-alone Forecasts are enabled, ensure they are not representing the same type of sales forecast (i.e. Line Item forecasts could represent Booking numbers, while stand-alone forecasts represent Billing numbers), so your numbers aren’t duplicated or inflated in SA views.
- Line Item forecasts include Oppty and DesWin line items, so be careful to avoid duplication (i.e. the same $15K/mo. For Customer A may be synchronizing under an oppty and also a DW, “appearing”to be $30K/mo when you view it in SA).
Best Practices, Tips, & Additional Info:
- Be sure your organization has a clear idea of the intended usage for the forecasts you enable. The information is more useful if everyone’s interpretation of, and commitment to, entering data is in synch.
- Carefully evaluate the various options available, as changing your mind midstream may require that previous forecasts be deleted before the configuration can be switched (i.e. if you started out using stand-alone Forecasts in “Option 1”and then decide you want to switch to “Option 2”, all forecasts created under Option 1, must be deleted before the configuration can be switched.
- Administrators should move the Forecast Profile on a regular basis (i.e. each month or quarter) so that relevant information displays in the views. (“Maintenance > Forecast Profile”)
- If your organization enables Key Acct/ROW, administrators may use Utilites to enable Key Account status on multiple accounts at once.
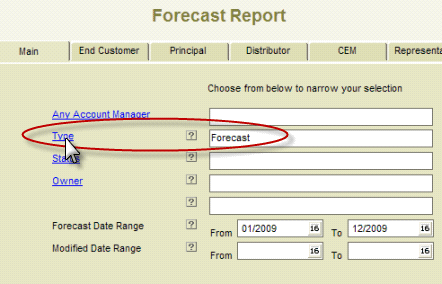
- Be sure, when reporting, to specifiy the “Type”, otherwise you’ll get a combined result which could be very inflated numbers!
Reporting:
Users with an AccountReporter license can choose to either run the standard (built-in) Forecast Report, or create a Configurable Export to design their own Forecast Report.
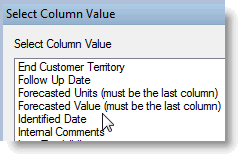
If you choose to create a Configurable Export, make sure your last column contains the one of the choices for “Forecast Units” (for quantities by period) or “Forecast Value” (for dollar amounts by period) so your report will populate correctly. (Click here for more information on AccountManager Configurable Exports).
